
Mathematica绘图——盒须图
基本用例
利用Mathematica绘制基本的盒须图(箱形图)的命令大致如下:
1 | data = RandomVariate[NormalDistribution[0, 1], {10, 100}]; |
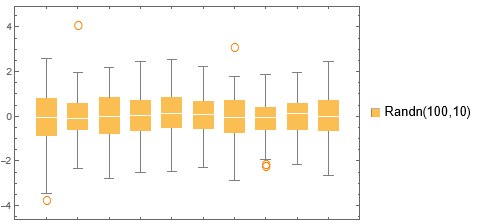
此时将会输出如下的图片
代码解释
data = RandomVariate[NormalDistribution[0, 1], {10, 100}];用于生成符合方差为的,均值为的正态分布的每组100个共10组数据。
BoxWhiskerChart用于绘制盒须图,其中:
data:表示需要绘制的数据{{"Outliers", "〇", Orange}}:显示异常值,显示的符号为〇,显示的颜色为Orange(橙色)。ChartLegends -> {"Randn(100,10)"}:表示图标的图例,也就是上图右边显示的“Randn(100,10)”。
实际案例
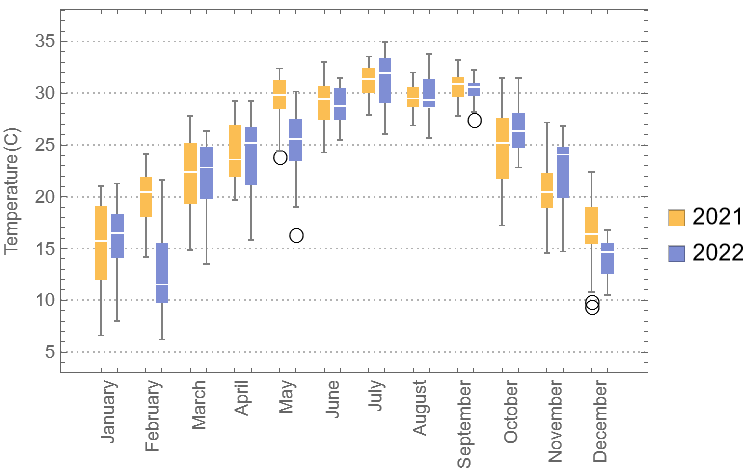
比如绘制广州市2021年和2022年的每天的平均气温,以月为一组的数据,共12组数据的盒须图。
数据获取与处理
首先获取广州市2021年和2022年的每天的平均气温的数据
1 | guangzhouData22 = WeatherData["Guangzhou", "Temperature", {{2022, 1, 1}, {2022, 12, 31}, "Day"}]; |
看到输出:
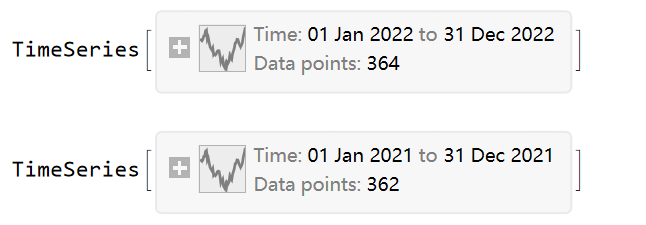
得到了两个时间序列,同时发现两组数据的Data points都不足,即没能获取到全年的数据,于是需要找出缺失了哪一天的数据。
进一步地,选择获取时间序列可用属性列表:
1 | guangzhouData22["Properties"] |
得到
1 | {DatePath,Dates,FirstDate,FirstTime,FirstValue,LastDate,LastTime,LastValue,Path,PathComponent,PathComponents,PathFunction,PathLength,Times,ValueDimensions,Values} |
发现Dates是所需的属性,于是提取所有的日期,并组成列表
1 | DateObject[#, DateFormat -> {"Month"}] & /@ guangzhouData22["Dates"] |
利用DataList、Counts和Values,求出每个月的统计的天数。
1 | Values[Counts[DateList[#][[2]] & /@ guangzhouData22["Dates"]]] |
进一步得到所求的数据的列表
1 | guangzhouListData22 = QuantityMagnitude[guangzhouData22["Values"]]~TakeList~(Values[Counts[DateList[#][[2]] & /@ guangzhouData22["Dates"]]]); |
盒须图的绘制
采用如下函数绘制:
1 | BoxWhiskerChart[ |
效果如下
选项说明
{guangzhouListData21, guangzhouListData22} // Transpose:表示绘制两组数据。{{"Outliers", "〇"}}:用〇显示缺失值。ChartLegends -> {"2021", "2022"},:指定图标图例为2021和2022年。PlotTheme -> "Detailed":使用Detailed主题。BarSpacing -> {Small, Large}:指定月份与月份之间的两组盒须图的距离为Large和指定同一月份下两组盒须图的距离间隔是Small。ChartLabels -> {Rotate[#, \[Pi]/2] & /@ {"January", "February", "March", "April", "May", "June", "July", "August", "September", "October", "November", "December"}, {None, None}}:指定图表的标签为月份,同时图标的标签逆时针旋转。FrameLabel -> {None, "Temperature(C)"}:指定图表的左侧的标签为Temperature(C)。
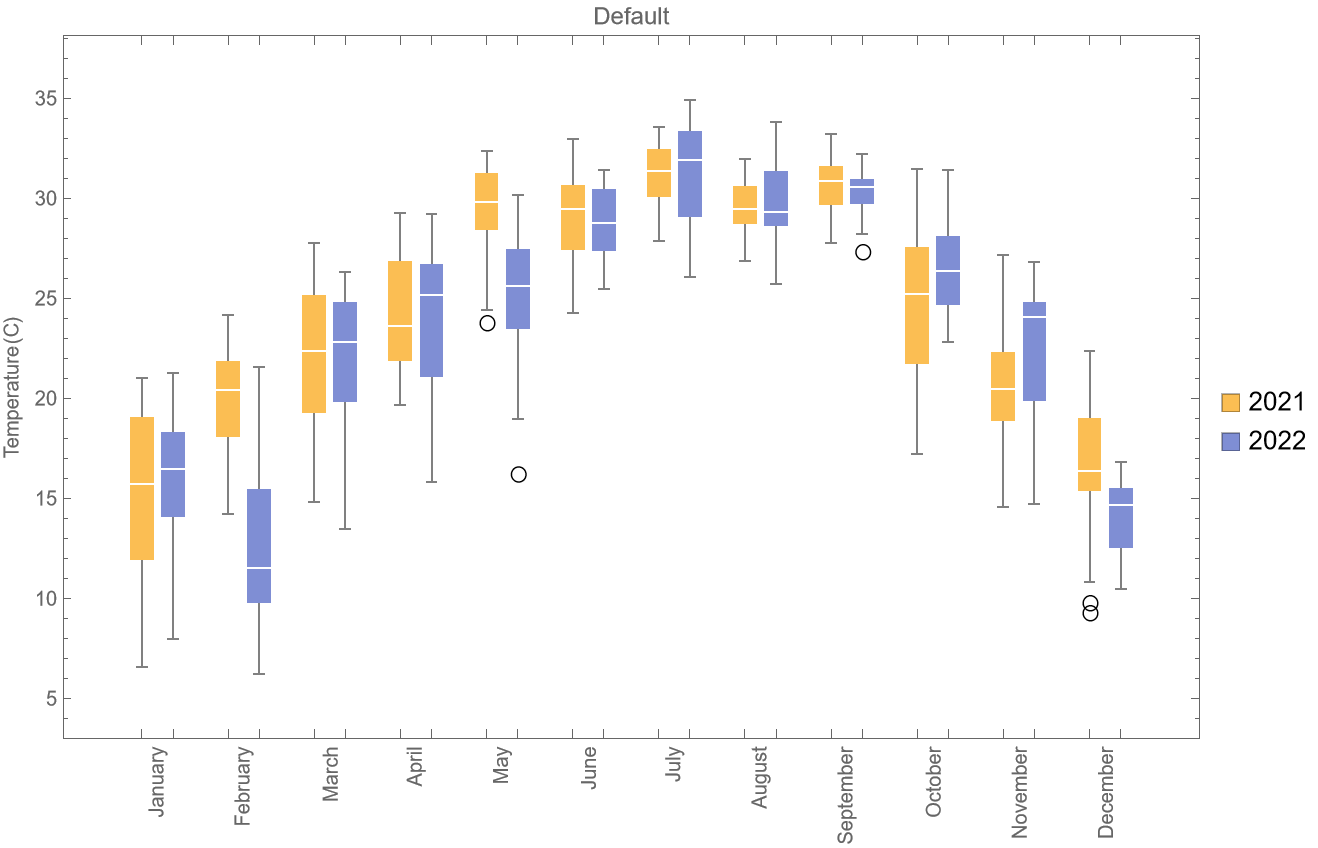
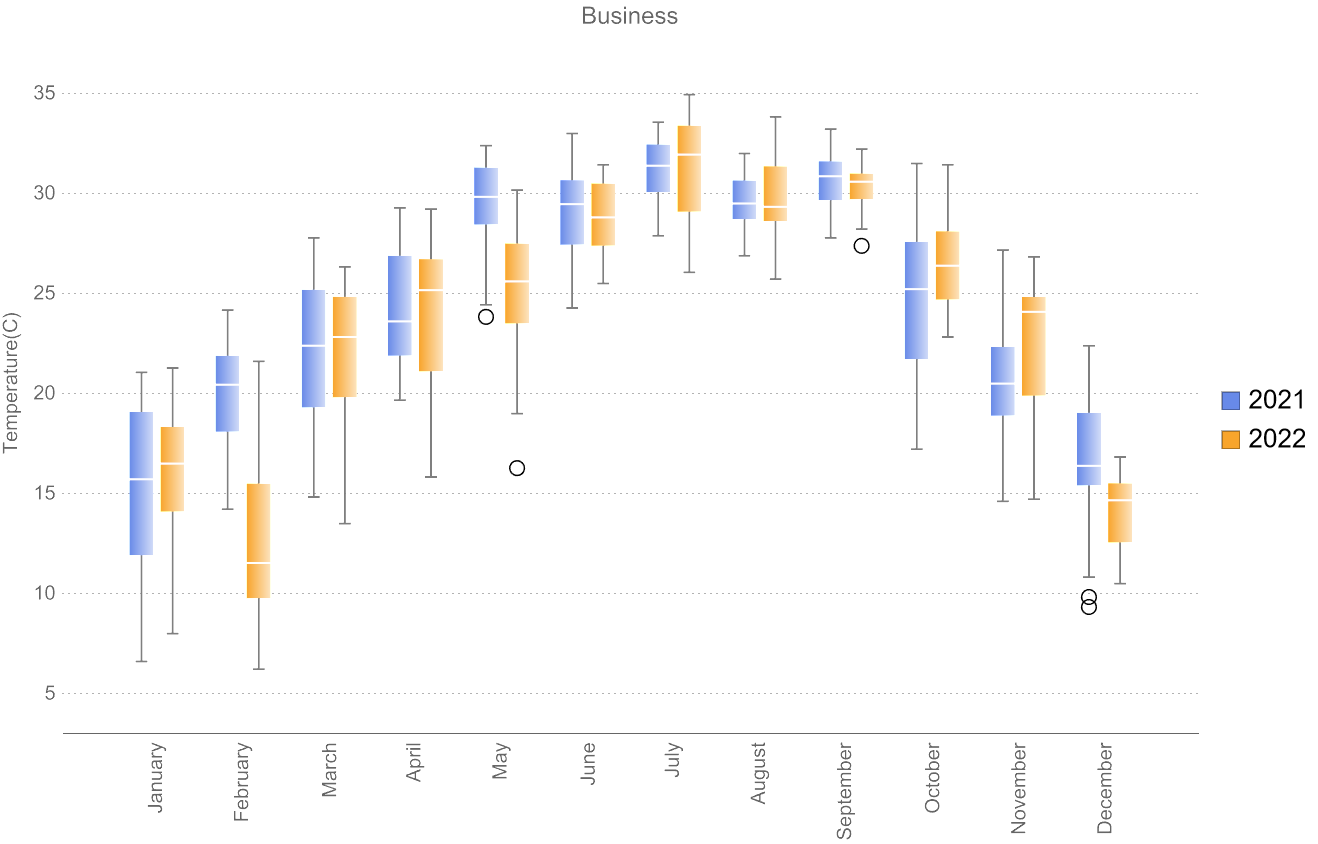
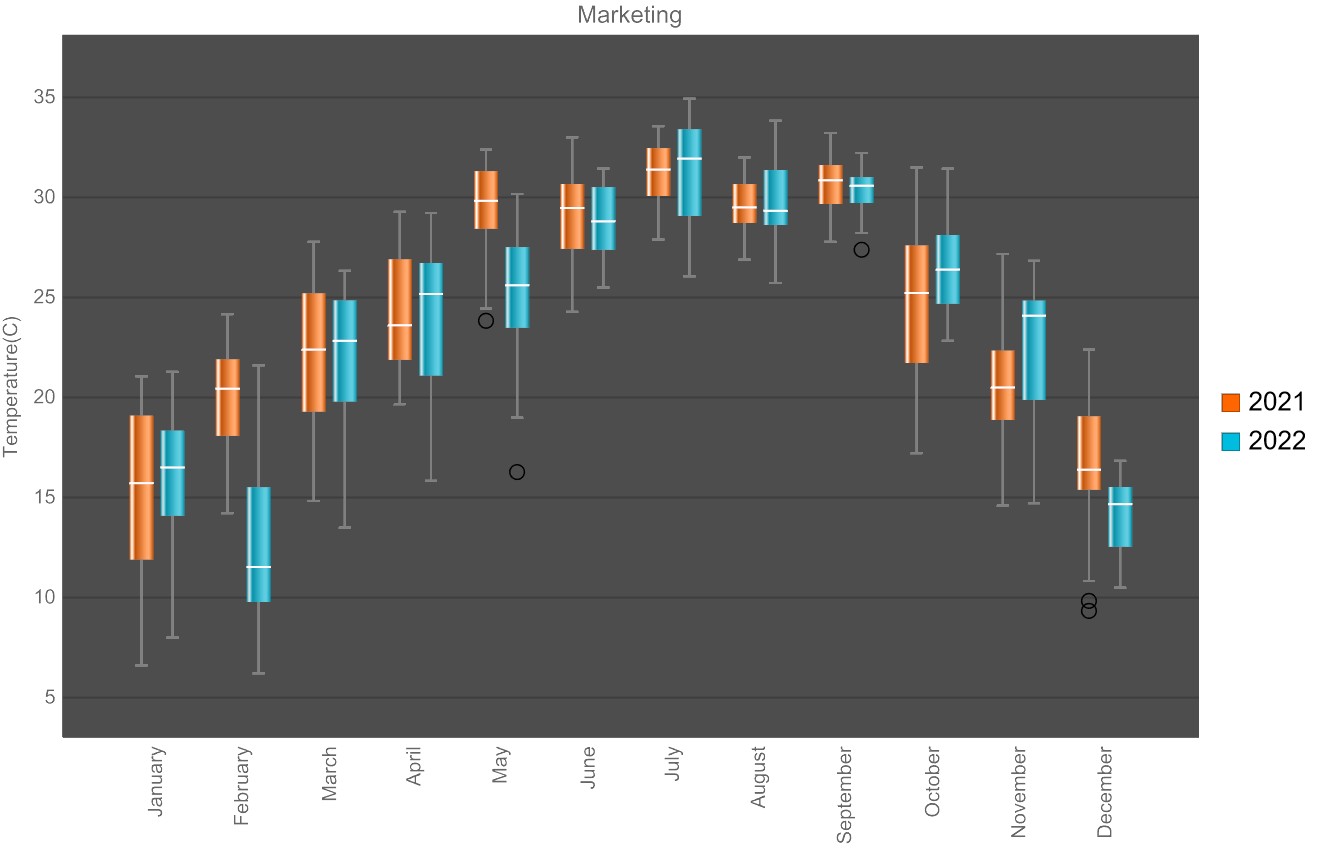
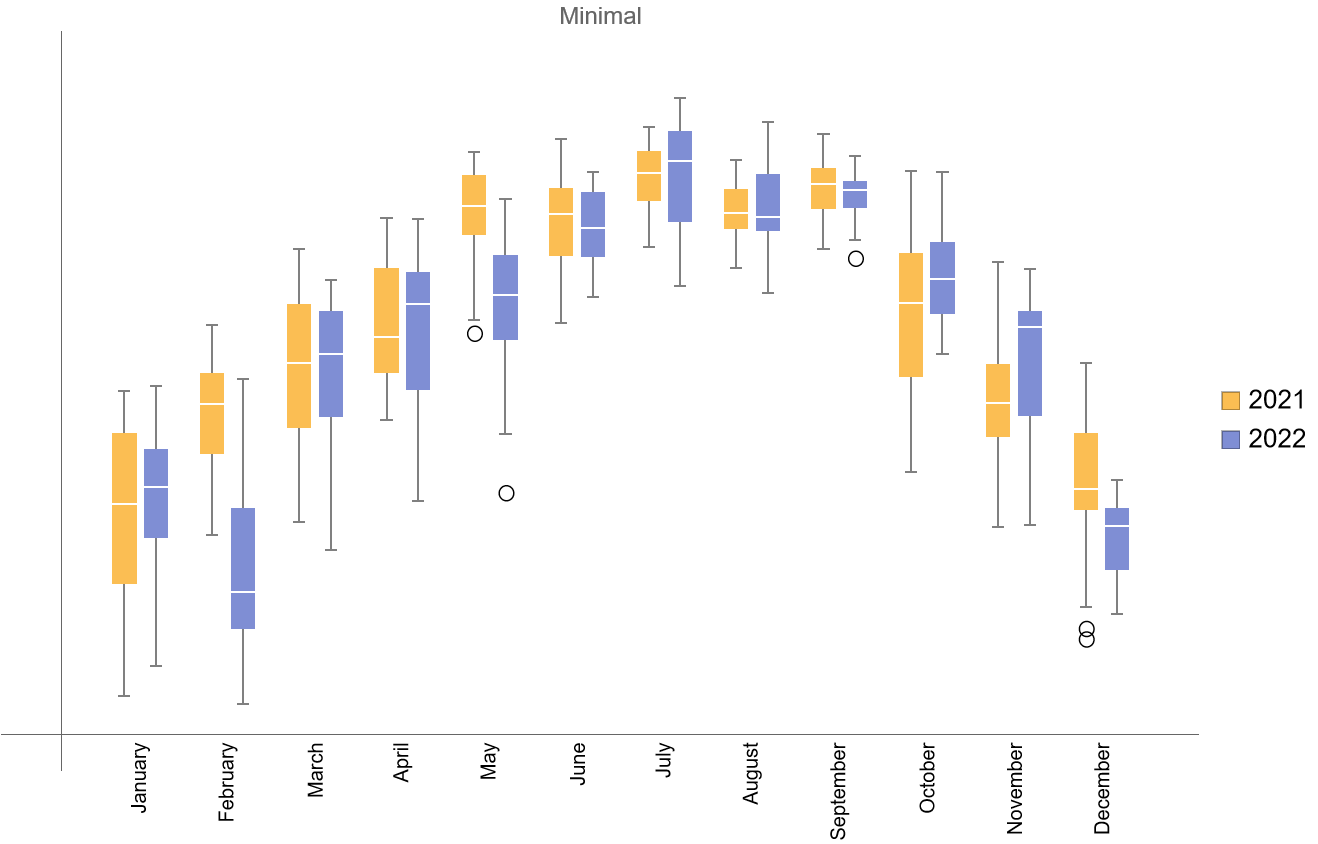
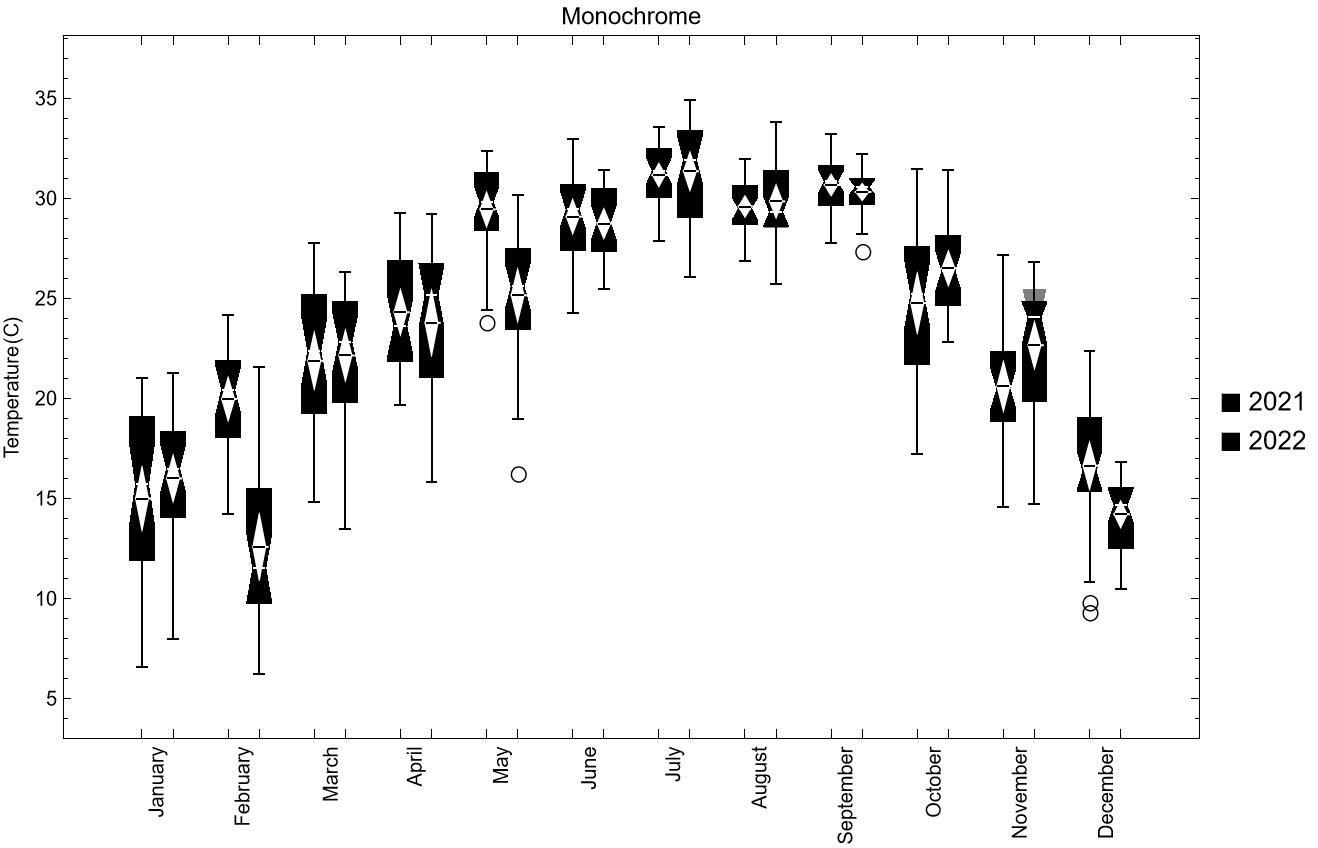
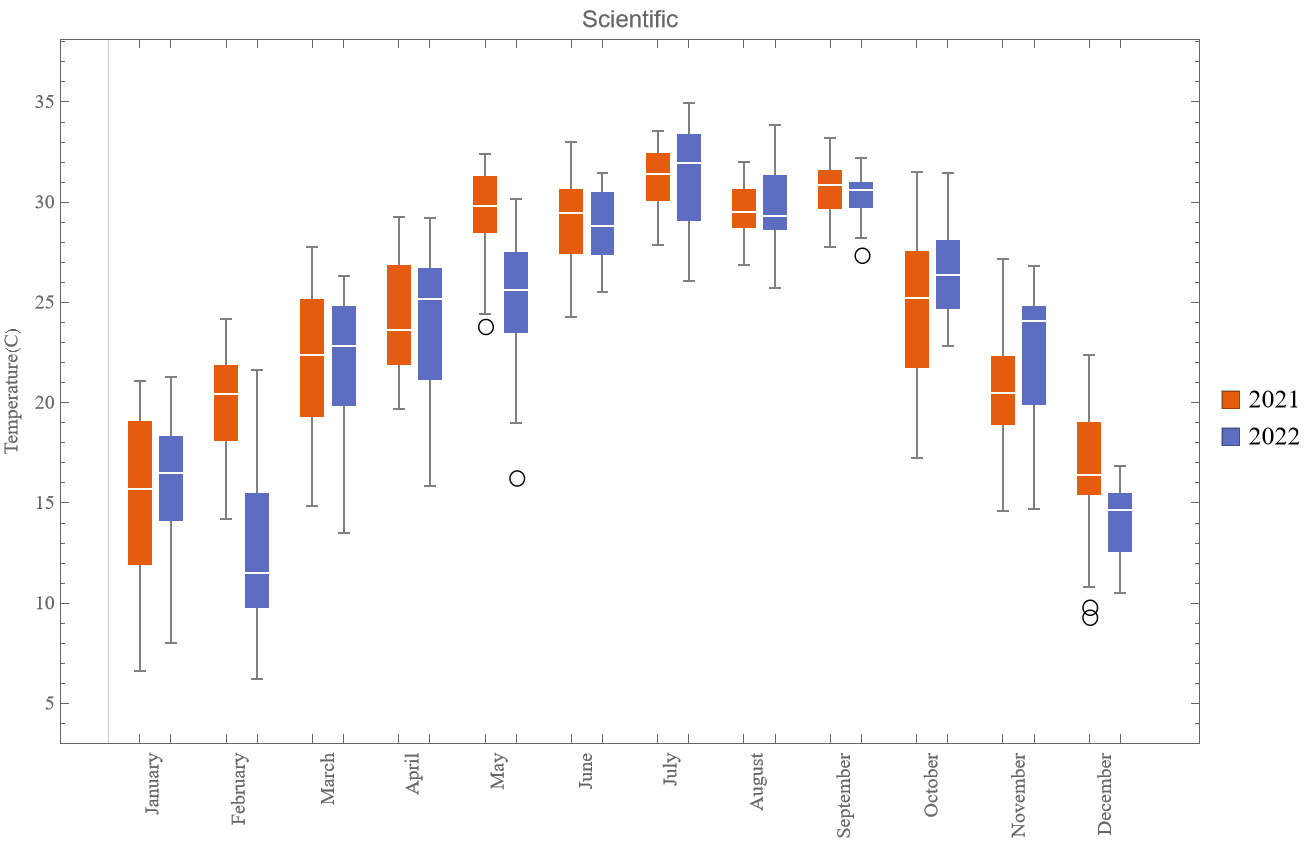
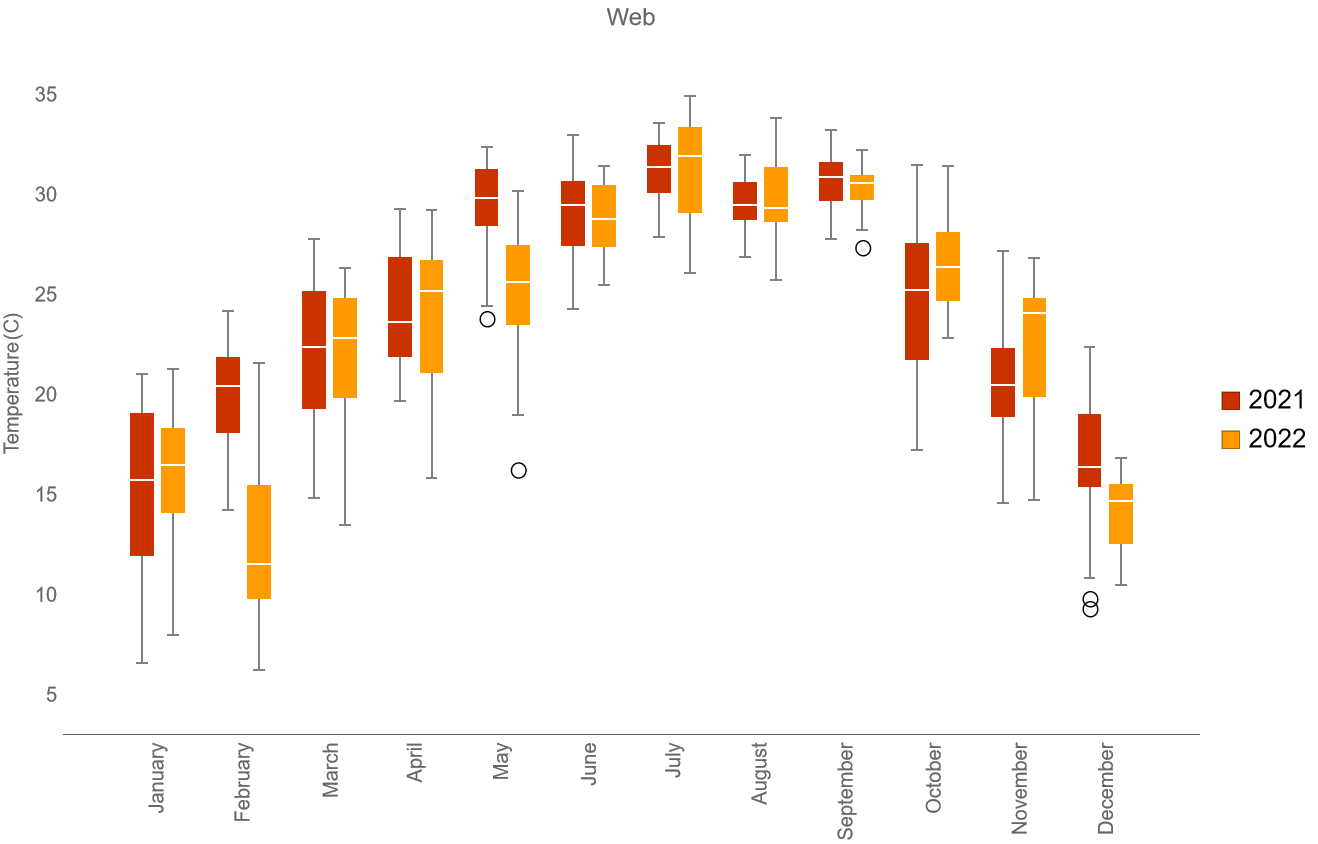
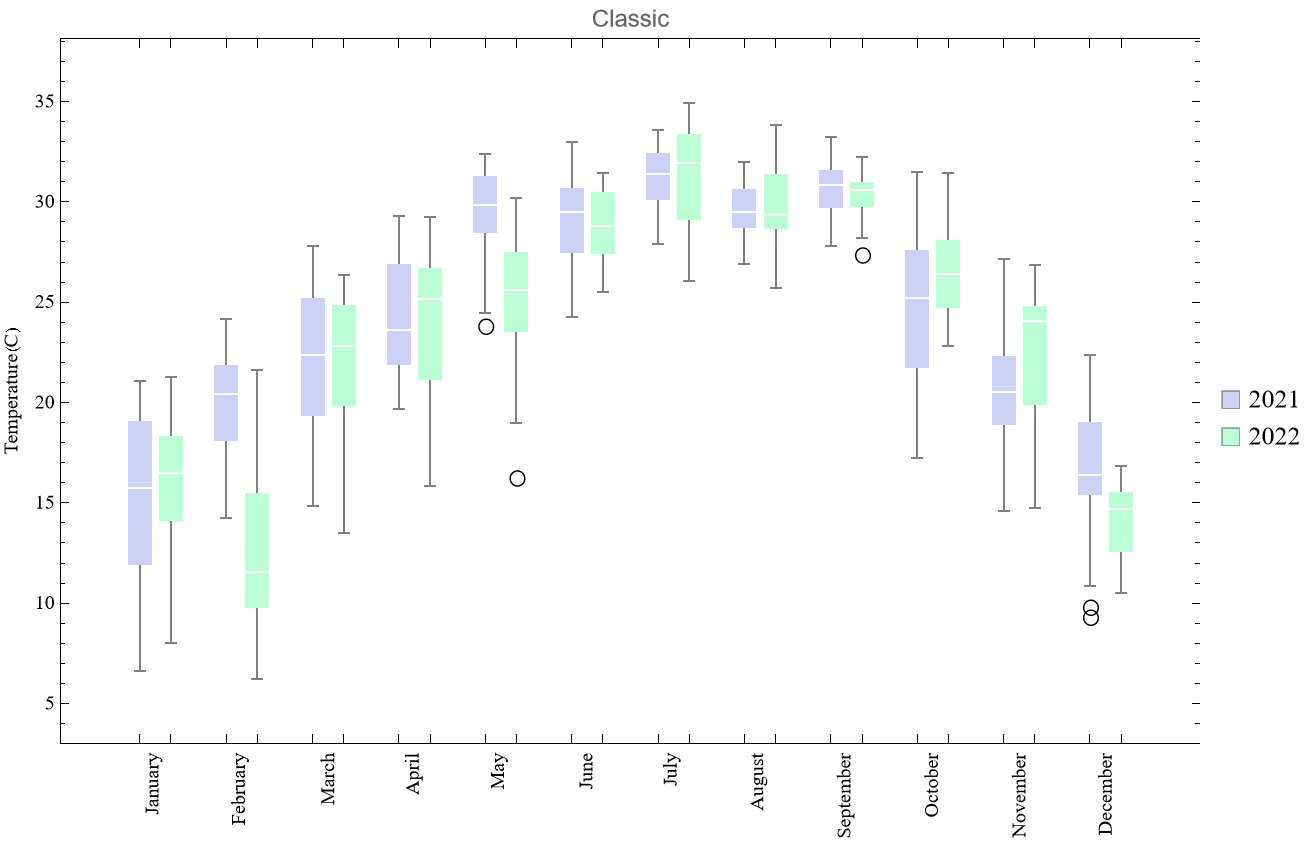
更多的绘图主题
在上面使用了Detailed主题。实际上可以使用如下主题:
Default, Business, Marketing, Detailed, Minimal, Monochrome, Scientific, Web, Classic
[{"url":"/media/mathematica/mathematica1/4.png","alt":""},{"url":"/media/mathematica/mathematica1/5.png","alt":""},{"url":"/media/mathematica/mathematica1/6.png","alt":""},{"url":"/media/mathematica/mathematica1/7.png","alt":""},{"url":"/media/mathematica/mathematica1/8.png","alt":""},{"url":"/media/mathematica/mathematica1/9.png","alt":""},{"url":"/media/mathematica/mathematica1/10.png","alt":""},{"url":"/media/mathematica/mathematica1/11.png","alt":""},{"url":"/media/mathematica/mathematica1/12.png","alt":""}]
1 | GraphicsGrid[ |
代码
1 | guangzhouData22 = WeatherData["Guangzhou", "Temperature", {{2022, 1, 1}, {2022, 12, 31}, "Day"}]; |

 微信赞赏码
微信赞赏码- 支付宝赞赏码
- 微信小程序赞赏码